Results
Cradle-to-ingot LCA of the functional unit — 1 kg of vacuum-arc-remelted
Ti-6Al-4V ingot (welded consumable electrode → road transport to the VAR
facility → remelting into a finished ingot) — characterising the
foreground inventory against the
ecoinvent-3.12-cutoff database. Three regional variants of the electricity
and transport flows are compared: Austria (AT), China (CN), and
United States (US).
Foreground parameters are held at their deterministic nominal values for the
baseline (pooled mean across cited sources, or an analyst-pinned nominal:; see
For Reviewers), while the Monte-Carlo panels propagate each
parameter's per-source distribution. The anchor method is IPCC 2021 — climate
change: total (excl. biogenic CO₂) — GWP100; the contribution tables also
report the EF v3.1 midpoint suite. Vanadium has no representative ecoinvent
activity and is modelled as a direct fossil-CO₂ emission (a cradle-to-gate carbon
proxy), so it contributes to climate change but to no other category.
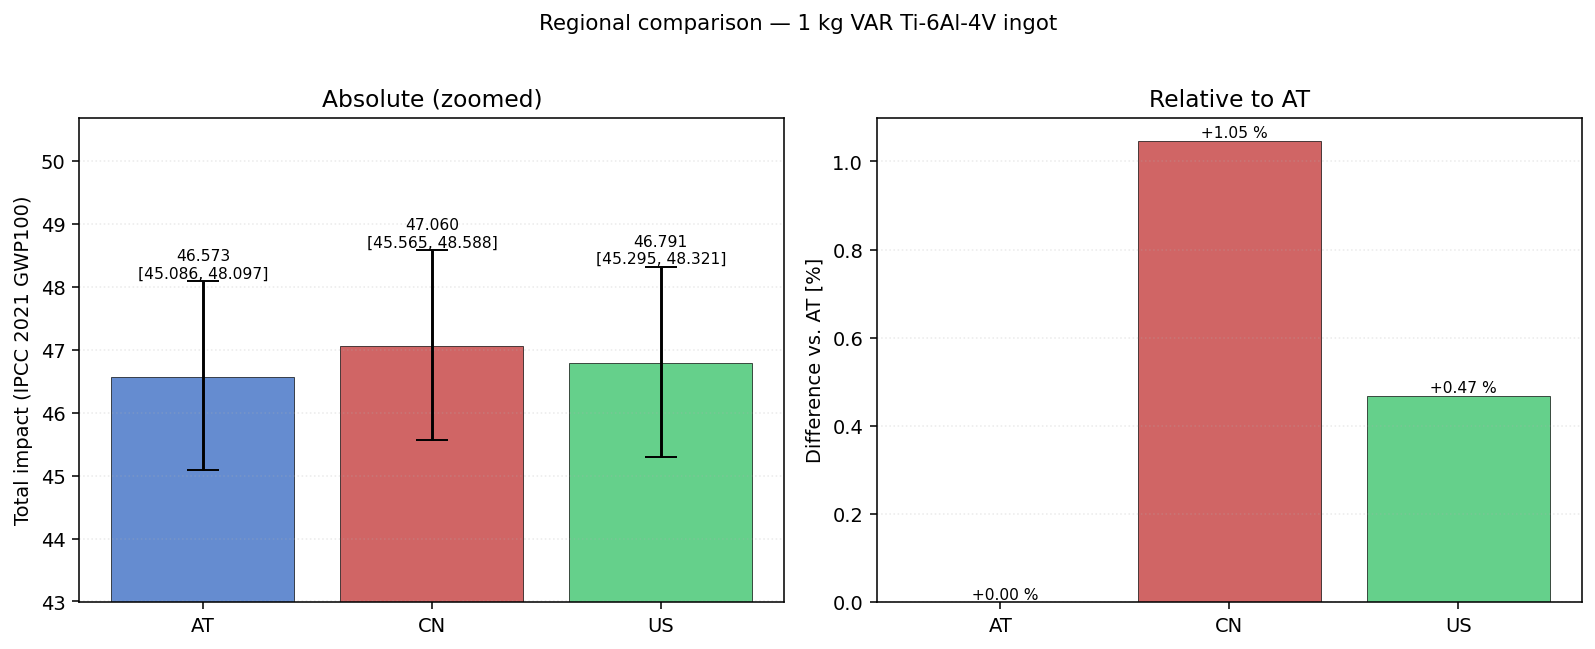
Regional comparison
Austria (AT)
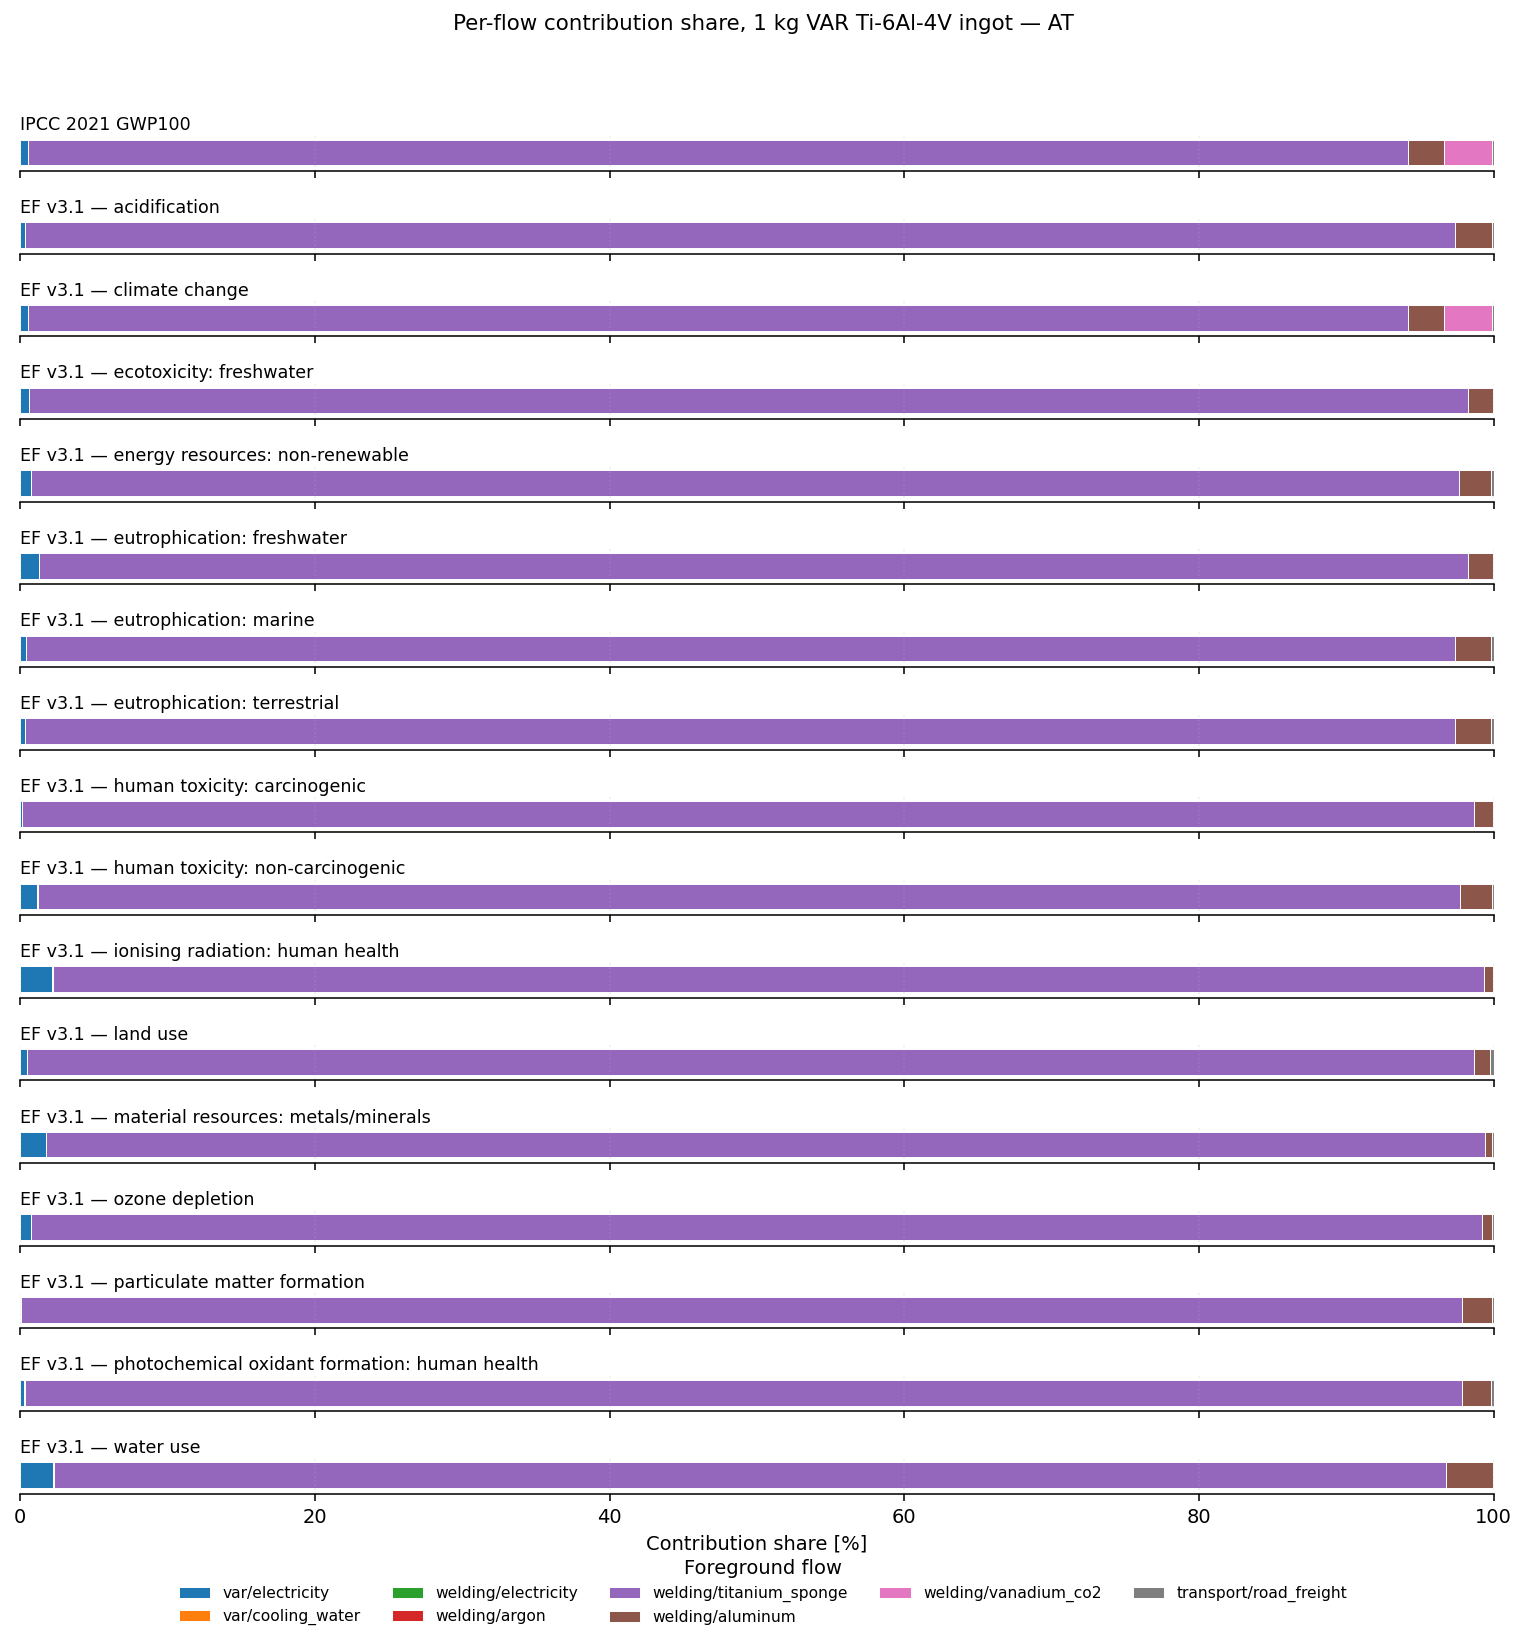
Contribution analysis
| Foreground flow | IPCC 2021 GWP100 (kg CO2-Eq) | EF v3.1 — acidification (mol H+-Eq) | EF v3.1 — climate change (kg CO2-Eq) | EF v3.1 — ecotoxicity: freshwater (CTUe) | EF v3.1 — energy resources: non-renewable (MJ, net calorific value) | EF v3.1 — eutrophication: freshwater (kg P-Eq) | EF v3.1 — eutrophication: marine (kg N-Eq) | EF v3.1 — eutrophication: terrestrial (mol N-Eq) | EF v3.1 — human toxicity: carcinogenic (CTUh) | EF v3.1 — human toxicity: non-carcinogenic (CTUh) | EF v3.1 — ionising radiation: human health (kBq U235-Eq) | EF v3.1 — land use (dimensionless) | EF v3.1 — material resources: metals/minerals (kg Sb-Eq) | EF v3.1 — ozone depletion (kg CFC-11-Eq) | EF v3.1 — particulate matter formation (disease incidence) | EF v3.1 — photochemical oxidant formation: human health (kg NMVOC-Eq) | EF v3.1 — water use (m3 world Eq deprived) |
|---|---|---|---|---|---|---|---|---|---|---|---|---|---|---|---|---|---|
| var/electricity | 0.25 | 0.00102 | 0.25 | 0.951 | 3.72 | 0.000284 | 0.000206 | 0.00176 | 7.74e-11 | 4.29e-09 | 0.0519 | 0.997 | 4.05e-06 | 6.82e-09 | 4e-09 | 0.000532 | 0.198 |
| var/cooling_water | 0.00189 | 9.74e-06 | 0.00189 | 0.00636 | 0.0323 | 1.26e-06 | 1.95e-06 | 1.85e-05 | 1.84e-12 | 1.03e-10 | 0.00062 | 0.00722 | 1.08e-08 | 2.82e-11 | 1.14e-10 | 5.94e-06 | 0.000884 |
| welding/electricity | 0.00426 | 1.73e-05 | 0.00426 | 0.0162 | 0.0633 | 4.83e-06 | 3.51e-06 | 2.99e-05 | 1.32e-12 | 7.29e-11 | 0.000883 | 0.0169 | 6.89e-08 | 1.16e-10 | 6.8e-11 | 9.04e-06 | 0.00337 |
| welding/argon | 0.000715 | 3.35e-06 | 0.000715 | 0.00166 | 0.0152 | 6.53e-07 | 6.06e-07 | 5.17e-06 | 1.17e-13 | 5.29e-12 | 0.00039 | 0.00224 | 1.64e-09 | 1.23e-11 | 1.18e-11 | 1.63e-06 | 0.00161 |
| welding/titanium_sponge | 43.6 | 0.279 | 43.6 | 160 | 486 | 0.0221 | 0.0478 | 0.495 | 5.31e-08 | 3.51e-07 | 2.34 | 211 | 0.000228 | 9e-07 | 4.79e-06 | 0.179 | 8.49 |
| welding/aluminum | 1.13 | 0.0073 | 1.13 | 2.72 | 10.9 | 0.000395 | 0.0012 | 0.0123 | 7.07e-10 | 7.86e-09 | 0.015 | 2.36 | 1.11e-06 | 6.2e-09 | 9.82e-08 | 0.00362 | 0.285 |
| welding/vanadium_co2 | 1.51 | 0 | 1.51 | 0 | 0 | 0 | 0 | 0 | 0 | 0 | 0 | 0 | 0 | 0 | 0 | 0 | 0 |
| transport/road_freight | 0.0519 | 0.000235 | 0.0519 | 0.11 | 0.745 | 3.73e-06 | 9.42e-05 | 0.00103 | 1.29e-11 | 5.06e-10 | 0.000881 | 0.558 | 1.75e-07 | 1.18e-09 | 5.11e-09 | 0.000363 | 0.00409 |
| Total | 46.5 | 0.288 | 46.5 | 164 | 502 | 0.0227 | 0.0493 | 0.51 | 5.39e-08 | 3.64e-07 | 2.41 | 215 | 0.000234 | 9.15e-07 | 4.89e-06 | 0.184 | 8.98 |
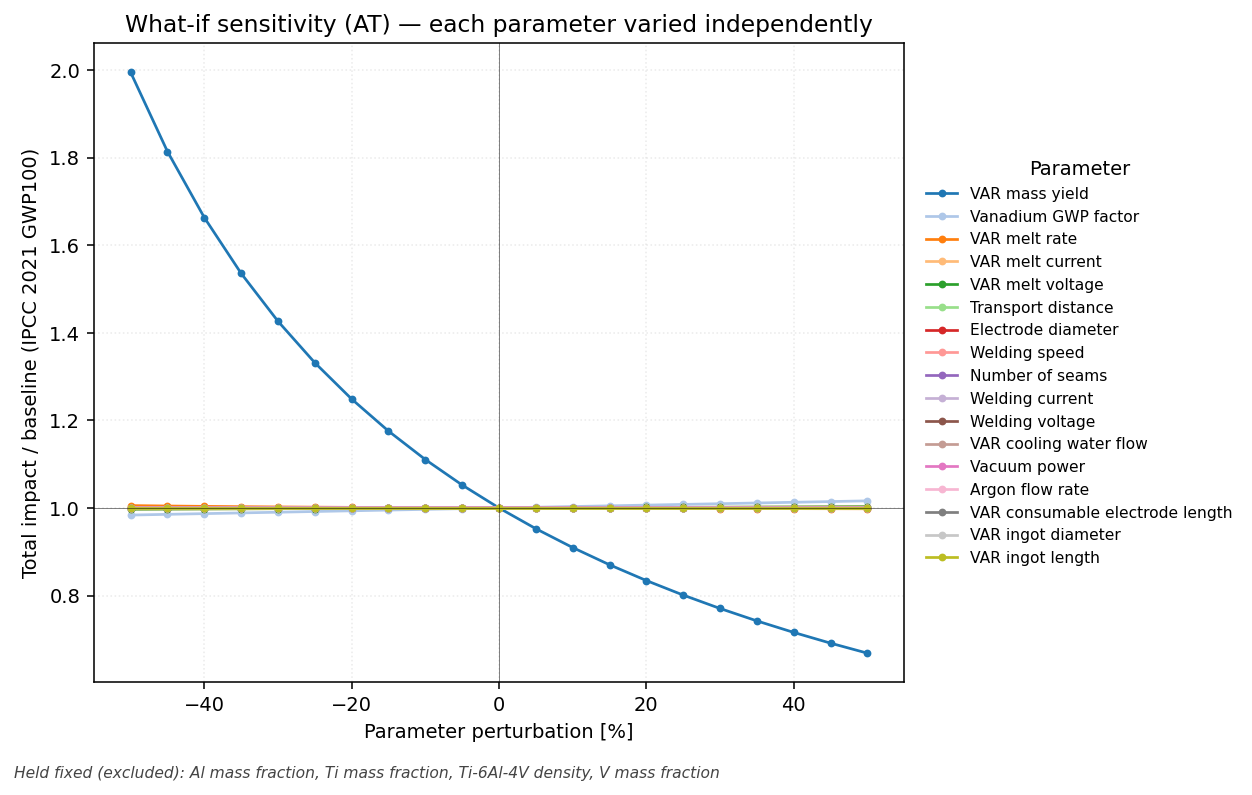
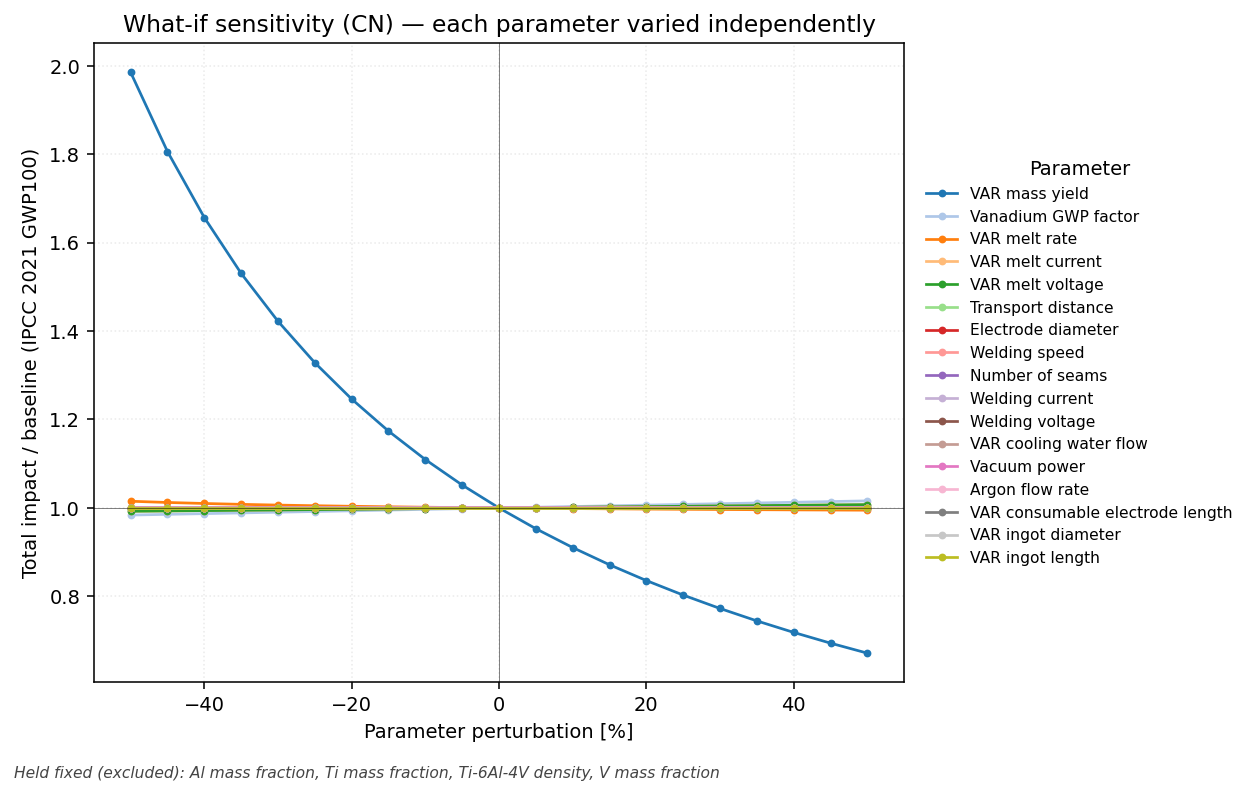
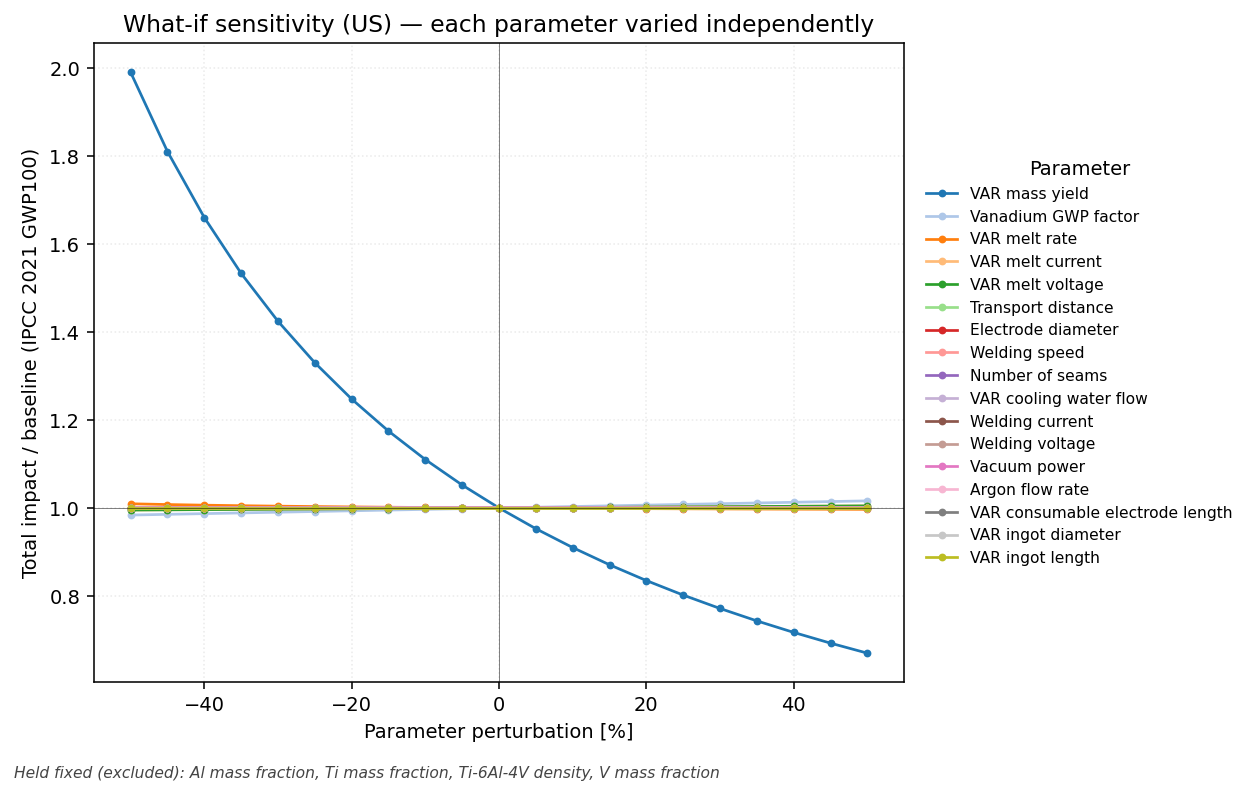
What-if sensitivity
Each foreground parameter is swept ±50 % with the others held at their nominal value; the curve is the resulting total impact relative to baseline (under the anchor method). Flat lines are parameters the result is insensitive to.
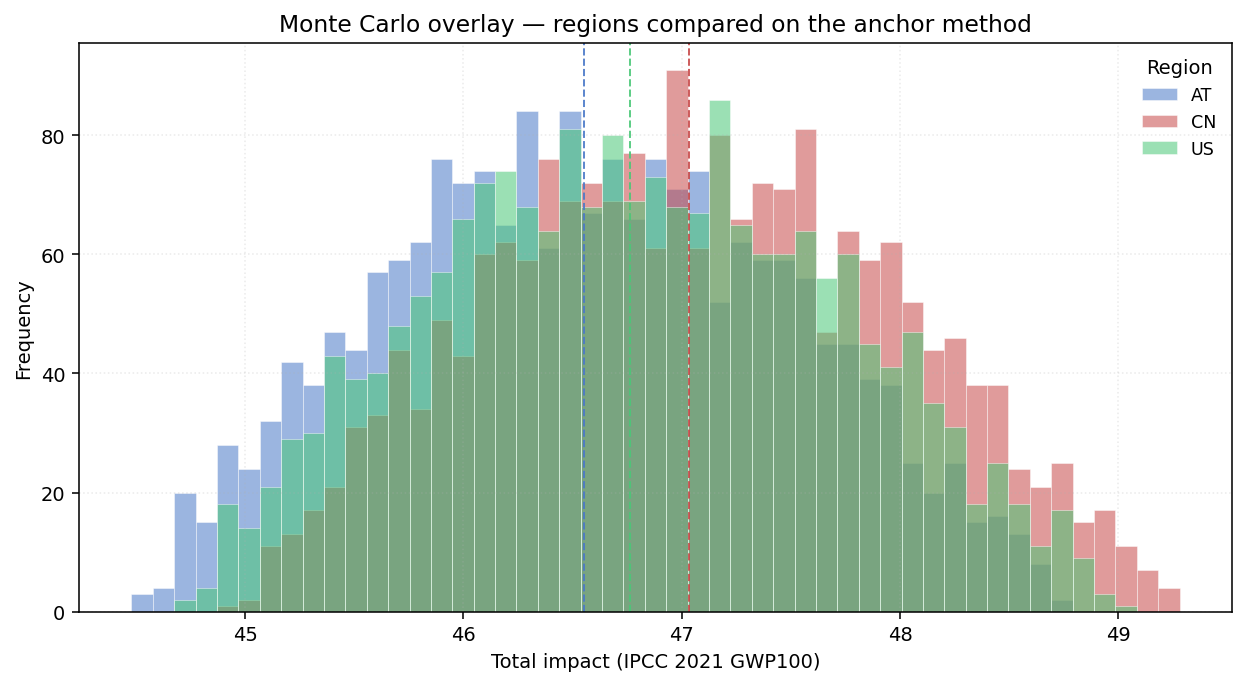
Monte Carlo uncertainty
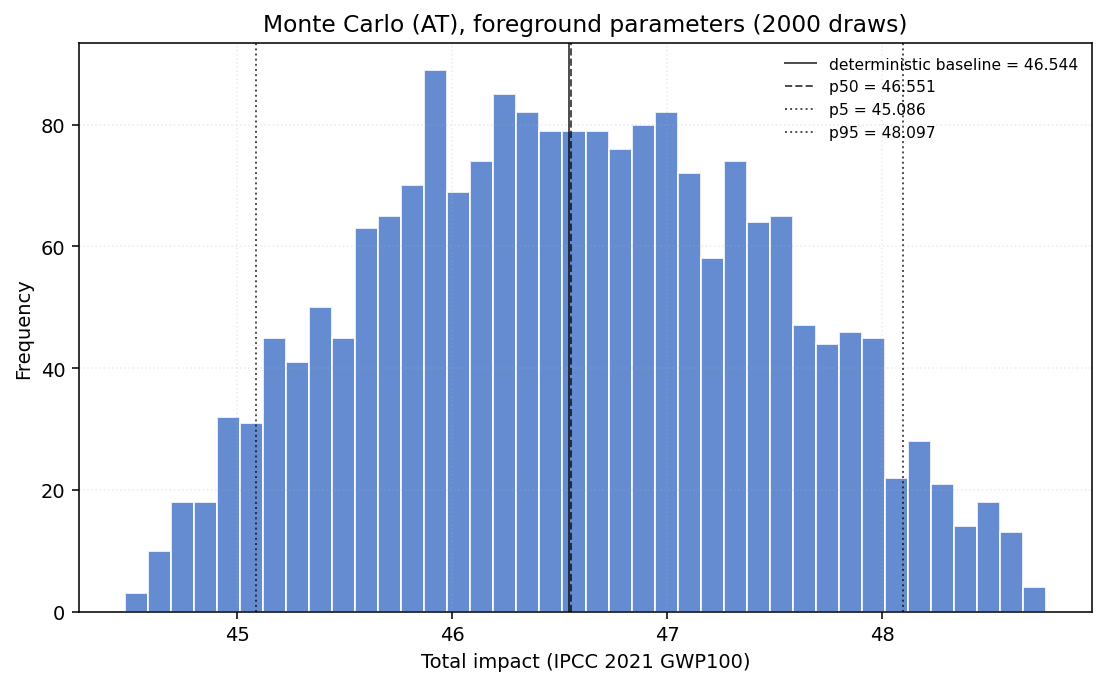
China (CN)
Contribution analysis
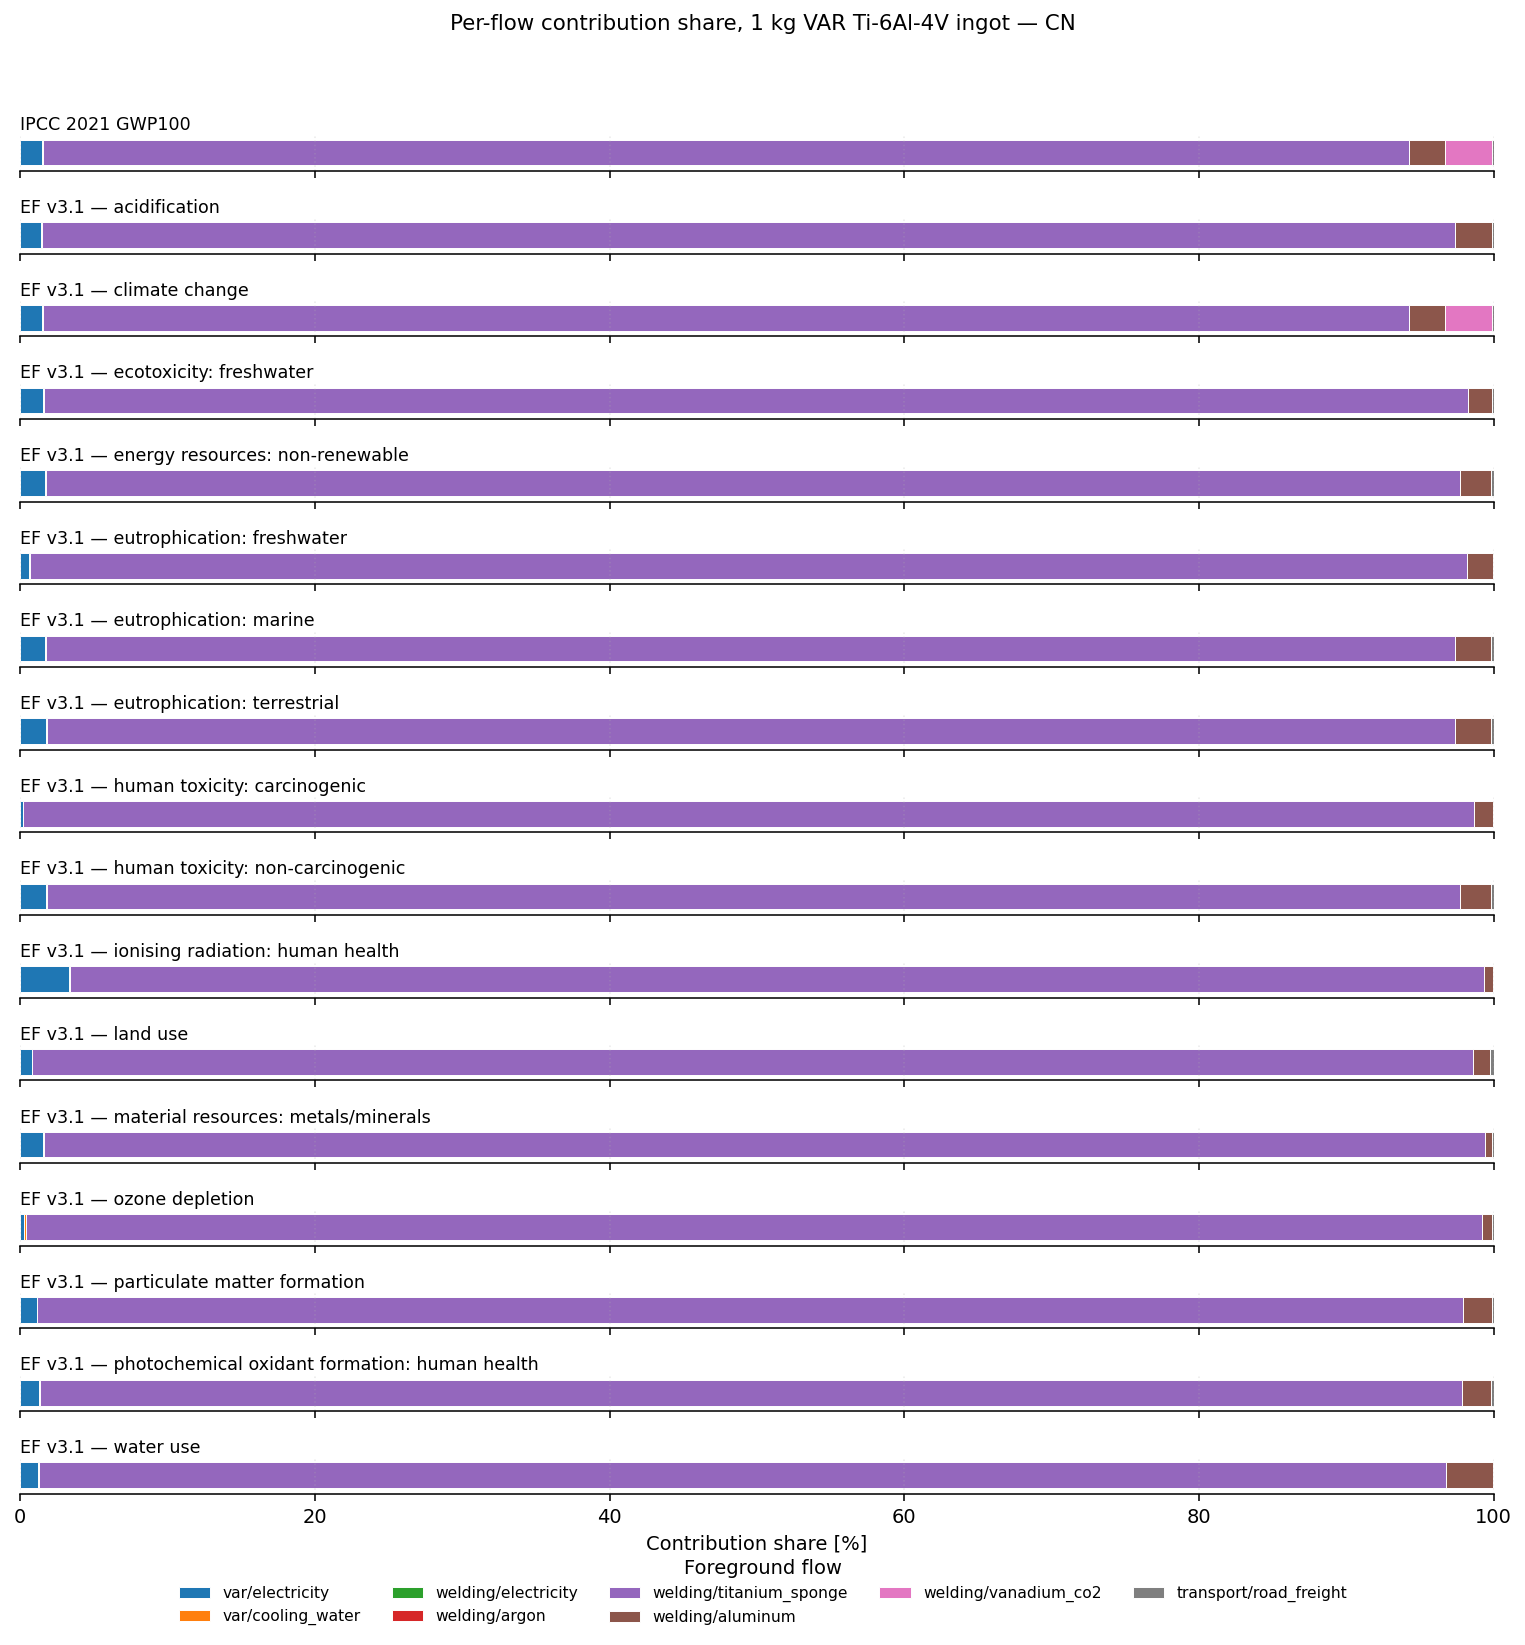
| Foreground flow | IPCC 2021 GWP100 (kg CO2-Eq) | EF v3.1 — acidification (mol H+-Eq) | EF v3.1 — climate change (kg CO2-Eq) | EF v3.1 — ecotoxicity: freshwater (CTUe) | EF v3.1 — energy resources: non-renewable (MJ, net calorific value) | EF v3.1 — eutrophication: freshwater (kg P-Eq) | EF v3.1 — eutrophication: marine (kg N-Eq) | EF v3.1 — eutrophication: terrestrial (mol N-Eq) | EF v3.1 — human toxicity: carcinogenic (CTUh) | EF v3.1 — human toxicity: non-carcinogenic (CTUh) | EF v3.1 — ionising radiation: human health (kBq U235-Eq) | EF v3.1 — land use (dimensionless) | EF v3.1 — material resources: metals/minerals (kg Sb-Eq) | EF v3.1 — ozone depletion (kg CFC-11-Eq) | EF v3.1 — particulate matter formation (disease incidence) | EF v3.1 — photochemical oxidant formation: human health (kg NMVOC-Eq) | EF v3.1 — water use (m3 world Eq deprived) |
|---|---|---|---|---|---|---|---|---|---|---|---|---|---|---|---|---|---|
| var/electricity | 0.706 | 0.00412 | 0.706 | 2.58 | 8.48 | 0.000141 | 0.000852 | 0.00906 | 9.58e-11 | 6.38e-09 | 0.0809 | 1.69 | 3.65e-06 | 2.46e-09 | 5.53e-08 | 0.00244 | 0.108 |
| var/cooling_water | 0.00733 | 3.92e-05 | 0.00733 | 0.0279 | 0.0907 | 2.61e-06 | 8.23e-06 | 8.43e-05 | 5.18e-12 | 2.24e-10 | 0.000606 | 0.0189 | 3.59e-08 | 1.41e-09 | 5.45e-10 | 2.52e-05 | 0.00186 |
| welding/electricity | 0.012 | 7e-05 | 0.012 | 0.0438 | 0.144 | 2.4e-06 | 1.45e-05 | 0.000154 | 1.63e-12 | 1.08e-10 | 0.00138 | 0.0287 | 6.21e-08 | 4.18e-11 | 9.4e-10 | 4.15e-05 | 0.00183 |
| welding/argon | 0.00131 | 6.46e-06 | 0.00131 | 0.00319 | 0.018 | 6.28e-07 | 1.31e-06 | 1.31e-05 | 1.5e-13 | 7.81e-12 | 0.000193 | 0.00261 | 1.51e-09 | 8.92e-12 | 5.78e-11 | 3.83e-06 | 0.00155 |
| welding/titanium_sponge | 43.6 | 0.279 | 43.6 | 160 | 486 | 0.0221 | 0.0478 | 0.495 | 5.31e-08 | 3.51e-07 | 2.34 | 211 | 0.000228 | 9e-07 | 4.79e-06 | 0.179 | 8.49 |
| welding/aluminum | 1.13 | 0.0073 | 1.13 | 2.72 | 10.9 | 0.000395 | 0.0012 | 0.0123 | 7.07e-10 | 7.86e-09 | 0.015 | 2.36 | 1.11e-06 | 6.2e-09 | 9.82e-08 | 0.00362 | 0.285 |
| welding/vanadium_co2 | 1.51 | 0 | 1.51 | 0 | 0 | 0 | 0 | 0 | 0 | 0 | 0 | 0 | 0 | 0 | 0 | 0 | 0 |
| transport/road_freight | 0.0555 | 0.000254 | 0.0555 | 0.176 | 0.777 | 6.12e-06 | 9.51e-05 | 0.00103 | 1.3e-11 | 5.2e-10 | 0.000639 | 0.577 | 1.84e-07 | 7.92e-10 | 5.21e-09 | 0.000357 | 0.00428 |
| Total | 47 | 0.291 | 47 | 166 | 507 | 0.0226 | 0.0499 | 0.518 | 5.39e-08 | 3.66e-07 | 2.44 | 216 | 0.000233 | 9.11e-07 | 4.95e-06 | 0.186 | 8.89 |
What-if sensitivity
Monte Carlo uncertainty
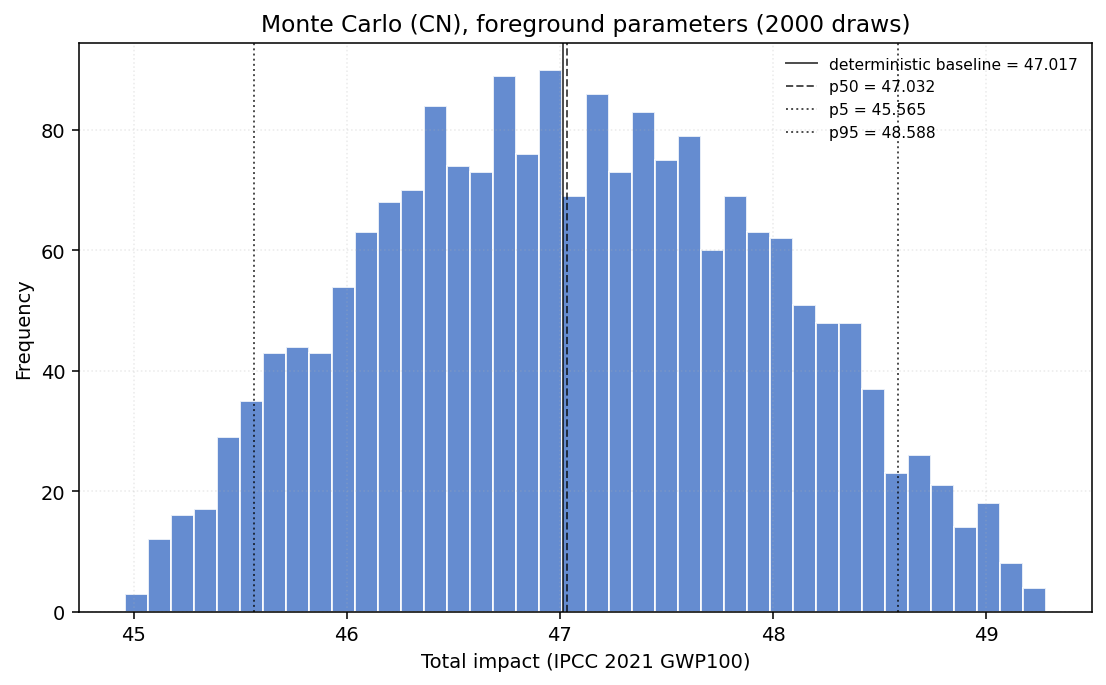
United States (US)
Contribution analysis
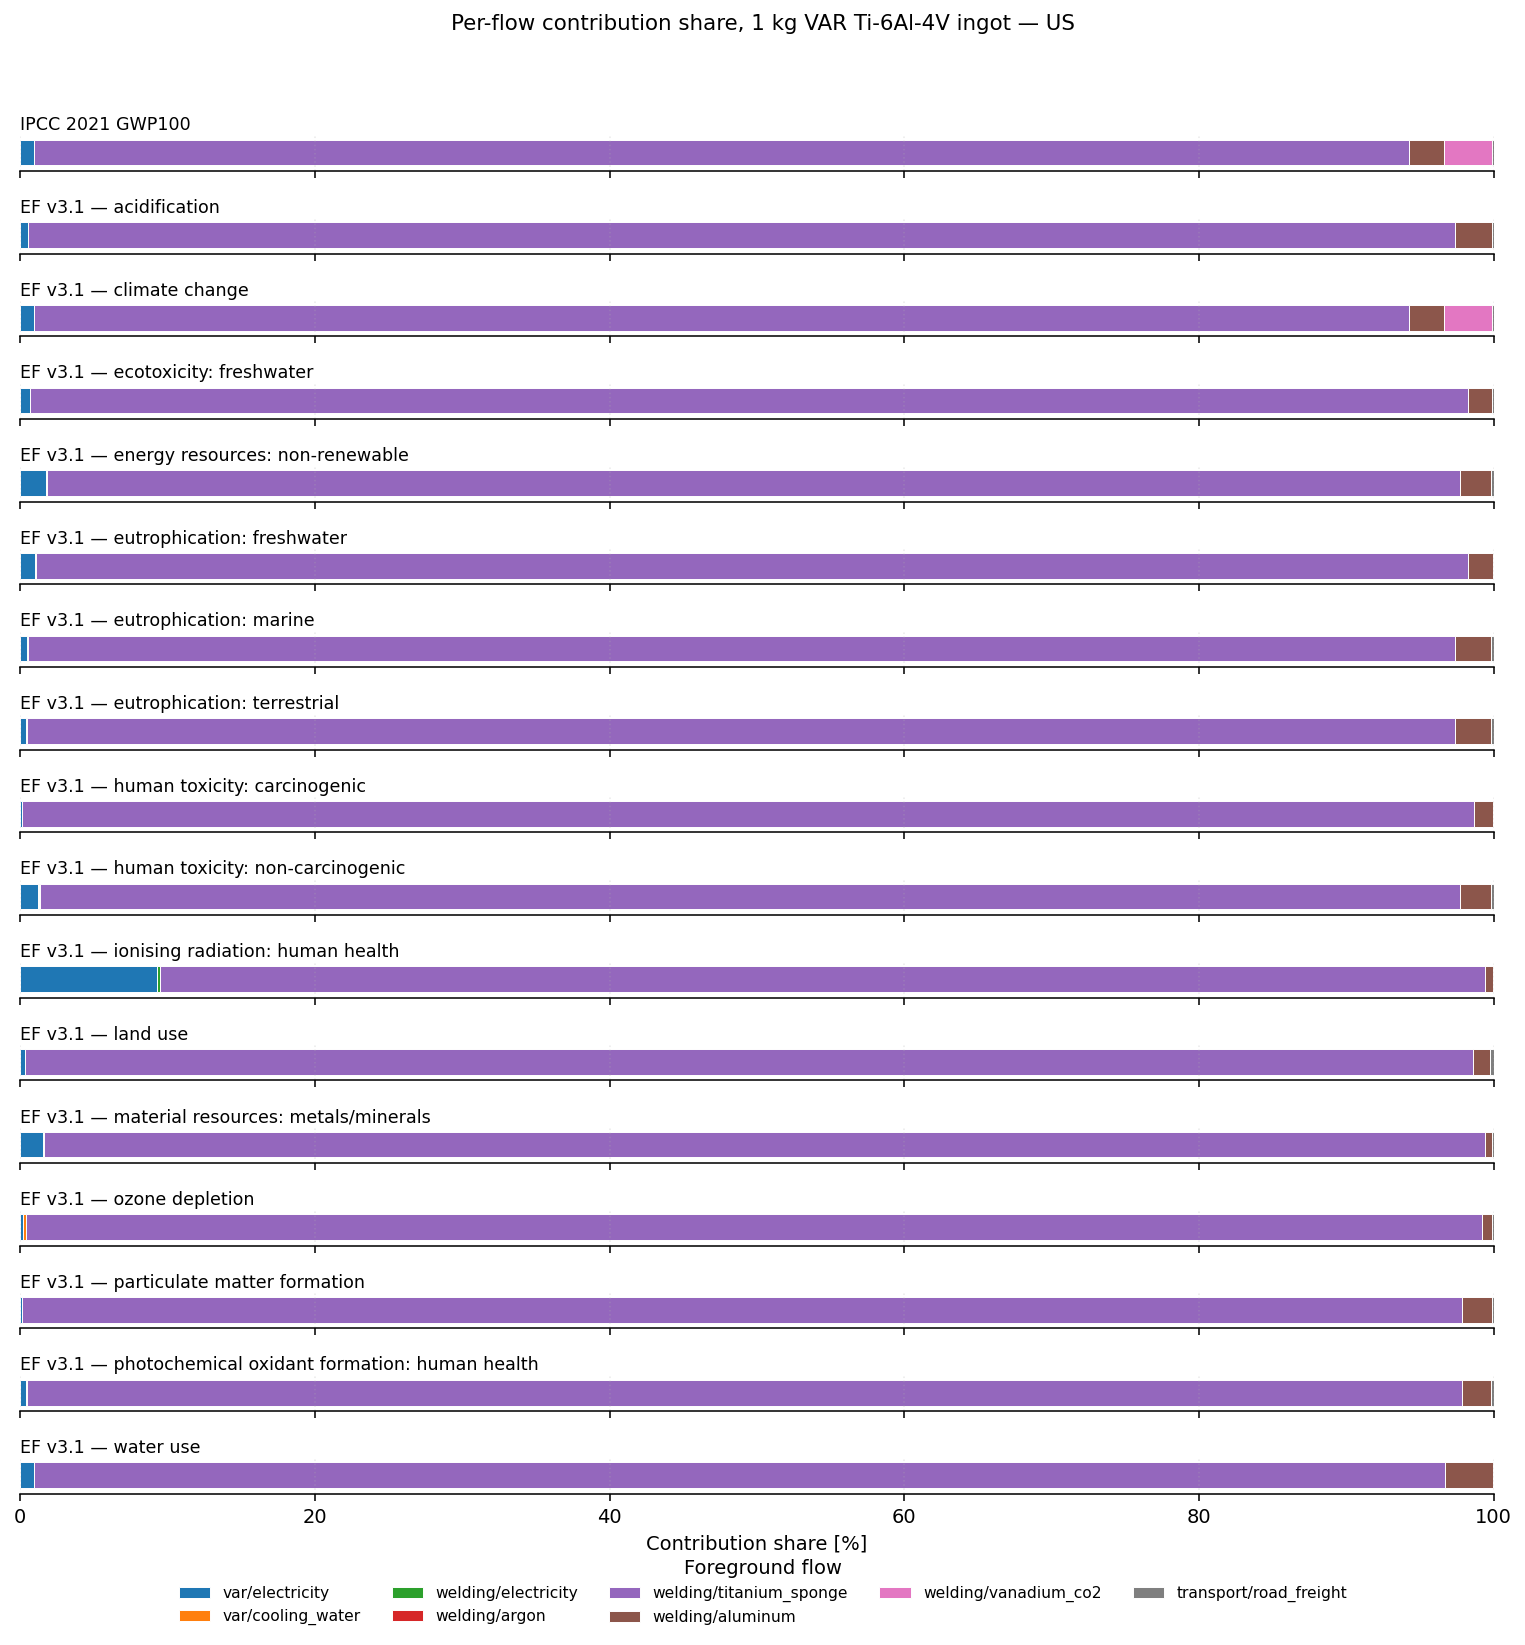
| Foreground flow | IPCC 2021 GWP100 (kg CO2-Eq) | EF v3.1 — acidification (mol H+-Eq) | EF v3.1 — climate change (kg CO2-Eq) | EF v3.1 — ecotoxicity: freshwater (CTUe) | EF v3.1 — energy resources: non-renewable (MJ, net calorific value) | EF v3.1 — eutrophication: freshwater (kg P-Eq) | EF v3.1 — eutrophication: marine (kg N-Eq) | EF v3.1 — eutrophication: terrestrial (mol N-Eq) | EF v3.1 — human toxicity: carcinogenic (CTUh) | EF v3.1 — human toxicity: non-carcinogenic (CTUh) | EF v3.1 — ionising radiation: human health (kBq U235-Eq) | EF v3.1 — land use (dimensionless) | EF v3.1 — material resources: metals/minerals (kg Sb-Eq) | EF v3.1 — ozone depletion (kg CFC-11-Eq) | EF v3.1 — particulate matter formation (disease incidence) | EF v3.1 — photochemical oxidant formation: human health (kg NMVOC-Eq) | EF v3.1 — water use (m3 world Eq deprived) |
|---|---|---|---|---|---|---|---|---|---|---|---|---|---|---|---|---|---|
| var/electricity | 0.437 | 0.00146 | 0.437 | 1.1 | 9.06 | 0.000235 | 0.000236 | 0.00208 | 7.77e-11 | 4.53e-09 | 0.242 | 0.643 | 3.61e-06 | 1.92e-09 | 6.43e-09 | 0.000778 | 0.0805 |
| var/cooling_water | 0.00733 | 3.92e-05 | 0.00733 | 0.0279 | 0.0907 | 2.61e-06 | 8.23e-06 | 8.43e-05 | 5.18e-12 | 2.24e-10 | 0.000606 | 0.0189 | 3.59e-08 | 1.41e-09 | 5.45e-10 | 2.52e-05 | 0.00186 |
| welding/electricity | 0.00742 | 2.48e-05 | 0.00742 | 0.0187 | 0.154 | 3.99e-06 | 4.02e-06 | 3.54e-05 | 1.32e-12 | 7.71e-11 | 0.00411 | 0.0109 | 6.13e-08 | 3.26e-11 | 1.09e-10 | 1.32e-05 | 0.00137 |
| welding/argon | 0.00131 | 6.46e-06 | 0.00131 | 0.00319 | 0.018 | 6.28e-07 | 1.31e-06 | 1.31e-05 | 1.5e-13 | 7.81e-12 | 0.000193 | 0.00261 | 1.51e-09 | 8.92e-12 | 5.78e-11 | 3.83e-06 | 0.00155 |
| welding/titanium_sponge | 43.6 | 0.279 | 43.6 | 160 | 486 | 0.0221 | 0.0478 | 0.495 | 5.31e-08 | 3.51e-07 | 2.34 | 211 | 0.000228 | 9e-07 | 4.79e-06 | 0.179 | 8.49 |
| welding/aluminum | 1.13 | 0.0073 | 1.13 | 2.72 | 10.9 | 0.000395 | 0.0012 | 0.0123 | 7.07e-10 | 7.86e-09 | 0.015 | 2.36 | 1.11e-06 | 6.2e-09 | 9.82e-08 | 0.00362 | 0.285 |
| welding/vanadium_co2 | 1.51 | 0 | 1.51 | 0 | 0 | 0 | 0 | 0 | 0 | 0 | 0 | 0 | 0 | 0 | 0 | 0 | 0 |
| transport/road_freight | 0.0555 | 0.000254 | 0.0555 | 0.176 | 0.777 | 6.12e-06 | 9.51e-05 | 0.00103 | 1.3e-11 | 5.2e-10 | 0.000639 | 0.577 | 1.84e-07 | 7.92e-10 | 5.21e-09 | 0.000357 | 0.00428 |
| Total | 46.7 | 0.288 | 46.7 | 164 | 507 | 0.0227 | 0.0493 | 0.511 | 5.39e-08 | 3.65e-07 | 2.6 | 215 | 0.000233 | 9.11e-07 | 4.9e-06 | 0.184 | 8.86 |
What-if sensitivity
Monte Carlo uncertainty

Scope and caveats
- Foreground only. The score covers the modelled welding, transport, and VAR foreground flows resolved to ecoinvent background activities; it is not a full cradle-to-grave product LCA.
- Vanadium is a proxy. Modelled as a direct fossil-CO₂ emission, so it contributes to climate change but to no other category.
- VAR melt energy stays on physical operating points. Voltage, current, and
melt rate are physically coupled (one furnace set point), so they are not
sampled independently: the baseline is pinned to a coherent operating point
(Patel & Fiore, ≈0.91 kWh/kg, ~44 % arc-to-melt efficiency), and the
Monte-Carlo draws are recipe-coupled — each draw picks one literature
operating point and applies its V/I/ṁ together. This keeps
E_spec = V·I/ṁrealistic (≈0.88–0.91 kWh/kg) instead of the unphysical spread that independent pooling produced. - Regenerated locally. This page is produced by
scripts/generate_lca_analysis.pyagainst a local ecoinvent database and committed as static content — the docs CI has no ecoinvent, unlike the parameter tables, which are rebuilt from code on every build.